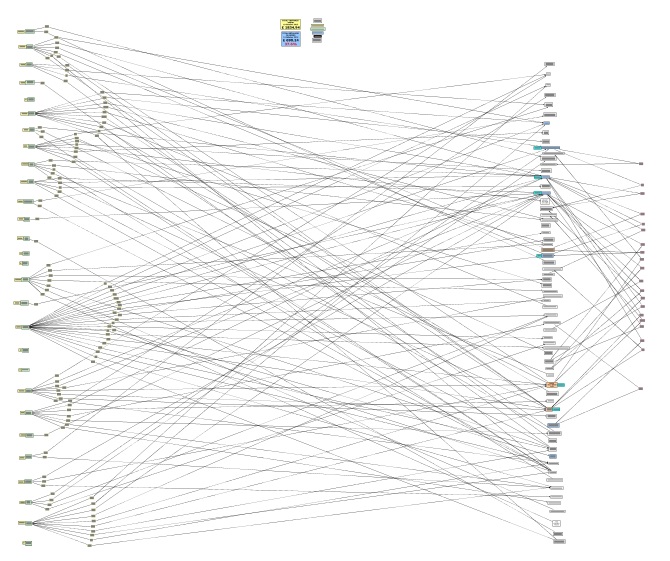
This is what the Game Board Currently Looks Like
It is created by all of the spending chains and loops generated by both customers and food businesses and represents the combined fruits of all our efforts.
Last updated 1 October 2016
It is created by all of the spending chains and loops generated by both customers and food businesses and represents the combined fruits of all our efforts.
Last updated 1 October 2016
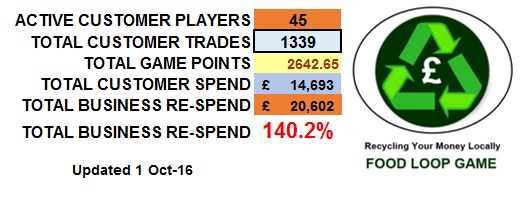
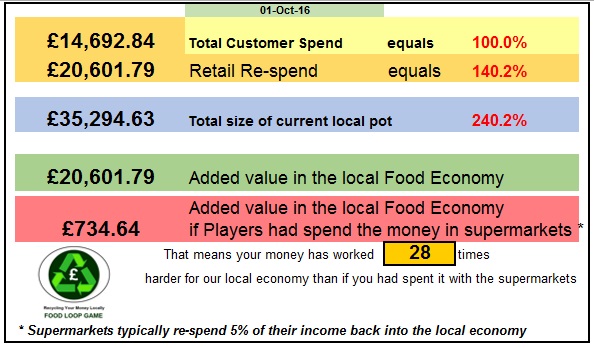
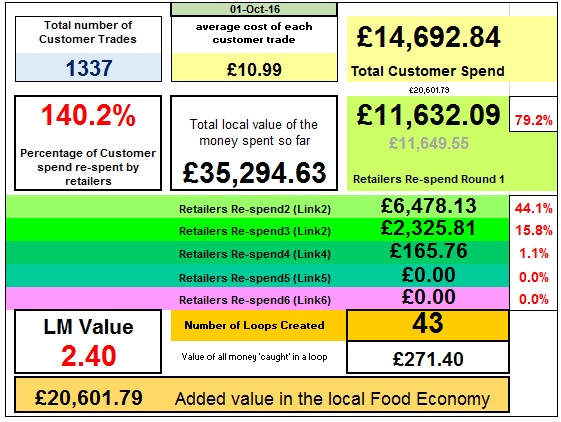
Here are three dashboards that display how things stand in the total system. To date players money spent with local food and drink suppliers has worked 28 times harder for the local economy that if the same amount has been spent with a large grocery chain, which typically only re-spends 5% of its turnover back into the local economy.
As the number of trades increases them gaming board is becoming more complicated as individual data points start to morph into meta-data. So I am looking for new ways of displaying all the interactive trading data in new meaningful ways.
This is a picture of all the data collected so far from both customers and the retailers re-spending your money. Over on the left is a list of all the customers. On the right are all the local businesses customers have spent with and over on the far right are the business to business re-trades.
This is a picture of all the data collected so far from both customers and the retailers re-spending your money. Over on the left is a list of all the customers. On the right are all the local businesses customers have spent with and over on the far right are the business to business re-trades.
The 'Classic' Gaming Board from August
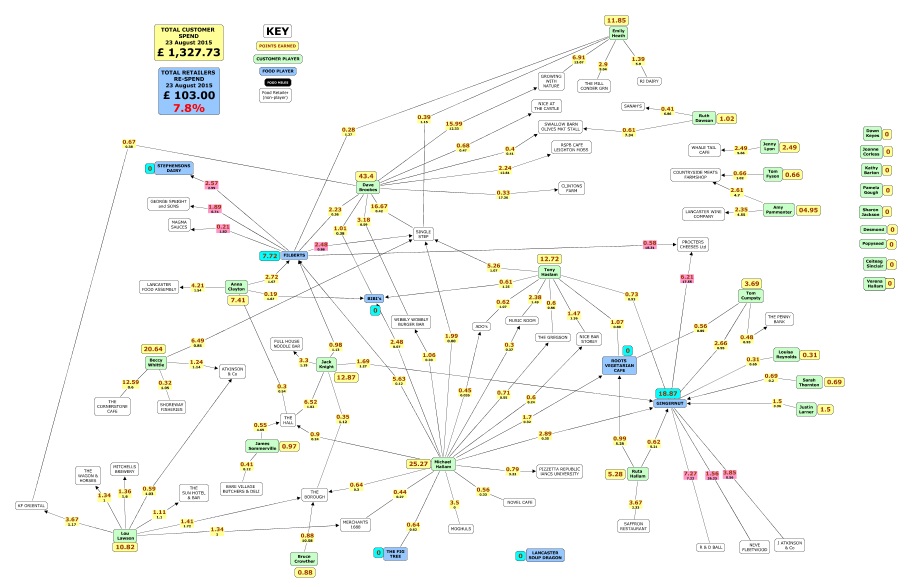
Game board from the 23 August 2015
